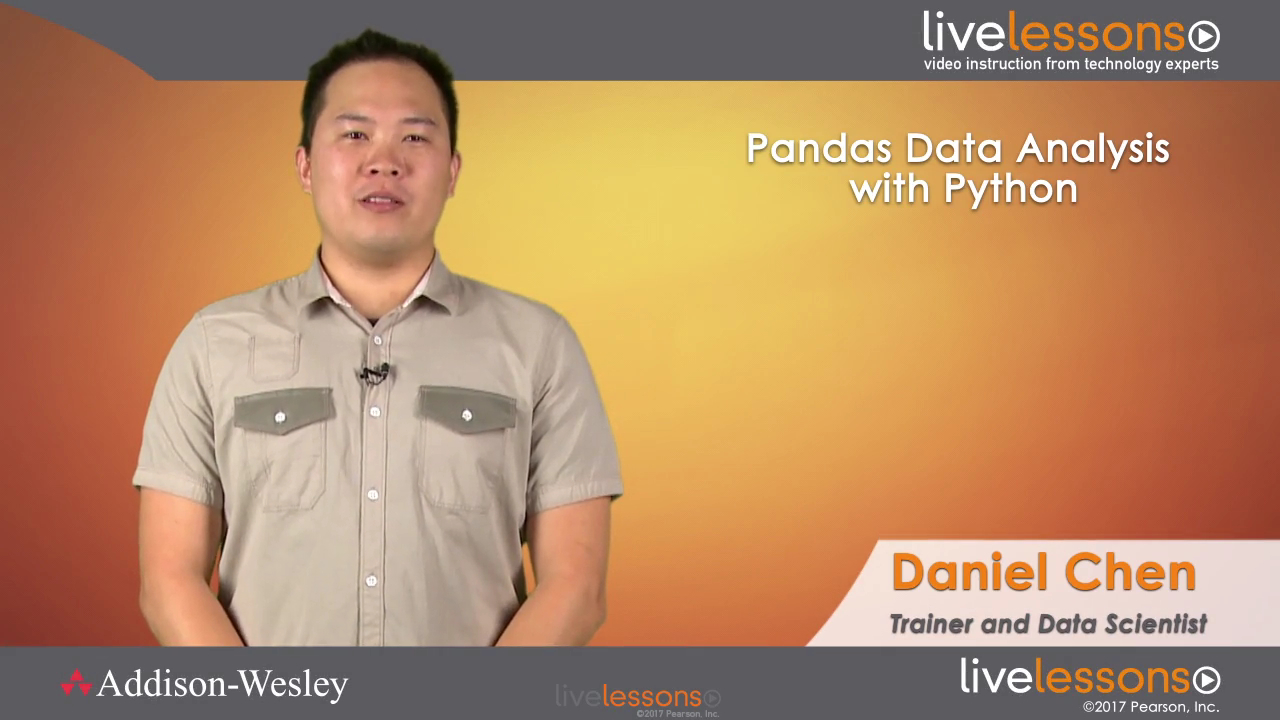
Pandas Data Analysis with Python Fundamentals LiveLessons
- By Daniel Y. Chen
- Published Feb 22, 2017 by Addison-Wesley Professional. Part of the LiveLessons series.

Online Video
- Your Price: $159.99
- List Price: $199.99
- About this video
Video accessible from your Account page after purchase.
Register your product to gain access to bonus material or receive a coupon.
Description
- Copyright 2017
- Edition: 1st
- Online Video
- ISBN-10: 0-13-469226-8
- ISBN-13: 978-0-13-469226-5
3+ Hours of Video Instruction
Pandas Data Analysis with Python Fundamentals LiveLessons provides analysts and aspiring data scientists with a practical introduction to Python and pandas, the analytics stack that enables you to move from spreadsheet programs such as Excel into automation of your data analysis workflows.
In this video training, Daniel starts by introducing Python and pandas and why they are great tools for data analysis. He then covers installing and starting Python. The video then moves into the basics of working with data sets in Python and with pandas, followed by plotting and visualization, data assembly and manipulations, missing data, and tidy data. After watching this video, analysts and those new to data science will understand why Python and pandas are so popular with data scientists and should be able to begin to create automated data workflows.
Skill Level
Beginner to Intermediate
What You Will Learn
- Installing and starting Python
- Loading data sets into pandas and beginning to assess and analyze them
- Using pandas data structures and importing/exporting data
- Combining multiple data sets
- Dealing with missing data
- Tidying and reshaping data
Who Should Take This Course
Analysts and aspiring data scientists looking to move beyond spreadsheets into automated data workflows.
Course Requirements
- Basic understanding of programming and development
- Some familiarity with basic data analysis
Table of Contents
Lesson 1: Installing and Running Python
Lesson 1 explains why the Python and pandas combination is great for data analysis. It also shows you how to install Python and the analytics stack and how to run Python.
Lesson 2: Pandas Basics
Lesson 2 covers some of the initial steps to take after you are given a dataset to analyze. You load data into pandas and then look at different subsets of the data. Finally, you learn how to perform your first simple set of analyses.
Lesson 3: Pandas Data Structures
Lesson 3 dives a little further into how pandas works. You learn how to create the pandas series and dataframe data structures. Next, you learn how you can use the pandas series object and pandas dataframe object. Last, how you import and export various types of data are covered.
Lesson 4: Introduction to Plotting
Lesson 4 emphasizes why visualization is important. You learn how to create a basic set of plots within matplotlib, Seaborn, and pandas.
Lesson 5: Data Assembly
Now that you know how to load and look at your data, the next step is assembling the data you need for analysis. Lesson 5 begins with concatenating data, that is, how to append data along the rows or columns. The lessons end with how to merge multiple data sets together.
Lesson 6: Missing Data
By now you have seen a few datasets with missing data. In Lesson 6 we begin to discuss what missing data is and how we get missing data. Your start learning how to work with missing data, including ways to find, count, and clean missing data. These are all important considerations when missing data is used in calculations.
Lesson 7: Tidy Data
Lesson 7 is concerned with tidy data. Tidy data describes the shape of your data that makes it easier to manipulate and analyze. The lesson covers Hadley Wickham’s tidy data paper that describes the ways data can be dirty. Finally, it covers the various ways you can reshape data.
About LiveLessons Video Training
The LiveLessons Video Training series publishes hundreds of hands-on, expert-led video tutorials covering a wide selection of technology topics designed to teach you the skills you need to succeed. This professional and personal technology video series features world-leading author instructors published by your trusted technology brands: Addison-Wesley, Cisco Press, IBM Press, Pearson IT Certification, Prentice Hall, Sams, and Que. Topics include: IT Certification, Programming, Web Development, Mobile Development, Home and Office Technologies, Business and Management, and more. View all LiveLessons on InformIT at: http://www.informit.com/livelessons
Sample Content
Table of Contents
Introduction
Lesson 1: Installing and Running Python
Learning objectives
1.1 Understand why Python/pandas for data analytics
1.2 Install Python
1.3 Run Python
Lesson 2: Pandas Basics
Learning objectives
2.1 Load your first data set
2.2 Look at your data
2.3 Analyze your first data set
Lesson 3: Pandas Data Structures
Learning objectives
3.1 Create data structures
3.2 Use pandas series
3.3 Use pandas data frame
3.4 Import and export data
Lesson 4: Introduction to Plotting
Learning objectives
4.1 Understand why data visualization is important
4.2 Create basic plots in matplotlib
4.3 Create basic plots in seaborn
4.4 Use plotting in pandas
Lesson 5: Data Assembly
Learning objectives
5.1 Concatenate data (stitch data)
5.2 Merge data (denormalization)
Lesson 6: Missing Data
Learning objectives
6.1 Understand the concept of a NaN value
6.2 Work with missing data
Lesson 7: Tidy Data
Learning objectives
7.1 Understand the concept of tidy data
7.2 Melt your data when columns contain values, not variables (melt)
7.3 Melt and parse when columns contain multiple variables
7.4 Pivot data when variables are in both rows and columns
7.5 Normalize data by separating multiple observational units in a table
7.6 Denormalize and assemble data when observational units are across multiple tables
Summary
More Information
