Java Performance LiveLessons (Video Training), Downloadable Version
- By Charlie Hunt
- Published Oct 18, 2013 by Addison-Wesley Professional. Part of the LiveLessons series.

Online Video
- Sorry, this book is no longer in print.
- About this video
Accessible from your Account page after purchase. Requires the free QuickTime Player software.
Videos can be viewed on: Windows 8, Windows XP, Vista, 7, and all versions of Macintosh OS X including the iPad, and other platforms that support the industry standard h.264 video codec.
Register your product to gain access to bonus material or receive a coupon.
Description
- Copyright 2014
- Edition: 1st
- Online Video
- ISBN-10: 0-13-344355-8
- ISBN-13: 978-0-13-344355-4
4+ Hours of Video Instruction
Based on the best-selling book,Java Performance, Java Performance LiveLessons covers the latest Oracle and third-party tools for monitoring and measuring performance on a wide variety of hardware architectures and operating systems. Renowned expert, Charlie Hunt, provides viewers with an overview of a modern Java Virtual Machine, the critical performance statistics to monitor within an operating system, JVM, and Java application, an overview of how the HotSpot garbage collectors work, an explanation of the garbage collection output produced by the garbage collectors, and a step-by-step approach to tuning a Java application.
Charlie Hunt is the Performance Engineering Architect at Salesforce.com. He was previously at Oracle, where he was responsible for improving the performance of the HotSpot JVM and Java SE class libraries. He has also been involved in improving the performance of the Oracle GlassFish and Oracle WebLogic servers. A regular JavaOne speaker on Java performance, he is coauthor of Java Performance (Addison-Wesley, 2011) and NetBeans™ IDE Field Guide (Prentice Hall, 2005).
Skill Level:
- Intermediate to Advanced Java programmer/developer
Who Should Take This Course?:
- Beginner to Advanced Java and JVM performance tuning engineer, and Advanced Java user / developer
What You Will Learn:
- The differences between a JRE and the JDK, how to install both, and the major components of the HotSpot Java Virtual Machine
- What performance statistics to monitor and collect and at each level of the software stack: OS, JVM, and Java application
- How to tune the JVM's garbage collector
- How to tune, step-by-step, the HotSpot JVM
Course Requirements:
- Fluent with, or a good understanding of, the Java programming language
- Basic understanding of a Java Virtual Machine is helpful, but not required
Lesson 1
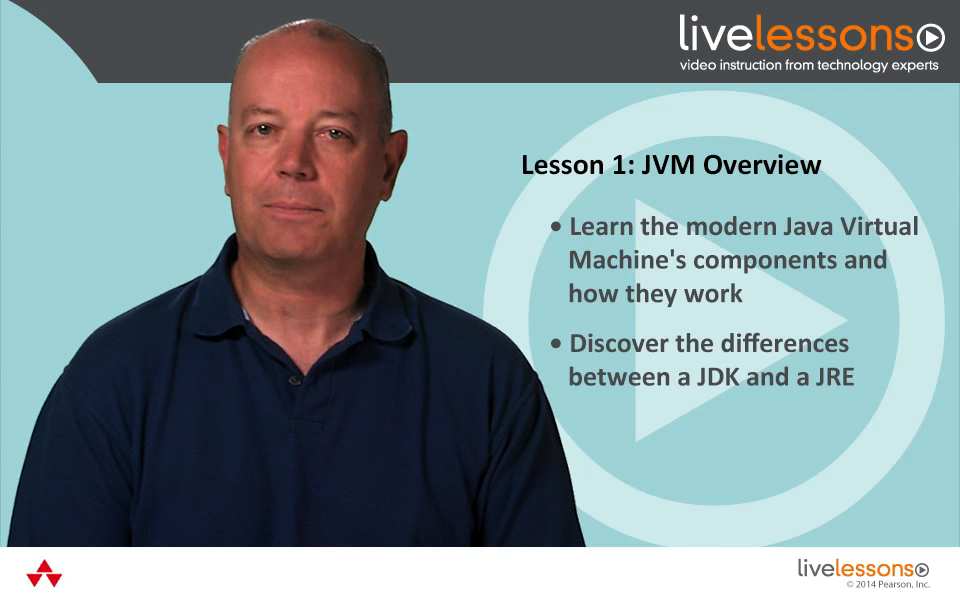
Lesson 1, “JVM Overview,” covers the differences between a JRE, the Java Runtime Environment, and the JDK (the Java Development Kit). It’s important to understand the differences since one of the differences is the inclusion of monitoring tools in the JDK but not the JRE. The lesson also includes a description of the major components of the HotSpot Java Virtual Machine as well as their roles and responsibilities.
Lesson 2
Lesson 2, “Collecting Performance Statistics,” begins to establish a methodology for assessing performance issues. Isolating the root cause of a performance issue requires a methodology that uses the collection of performance statistics and the resulting data to drive the next steps in the root cause analysis and ultimately provide a resolution. The approach extends to each level of the software stack: operating system, JVM and Java application. The lesson concludes with a discussion of the application level performance statistics you should monitor and suggests ones to incorporate if they are not included in the application already.
Lesson 3
Lesson 3, “Understand HotSpot JVM GC Logs,” starts with the assumption that tuning a JVM most oftentimes requires the tuning of the JVM’s garbage collector. This lesson illustrates how the HotSpot JVM’s Parallel GC, CMS GC and G1 GC work. Understanding how they work greatly increases your ability to tune them effectively. The lesson also includes a description of the meaning of each field produced in the GC logs for each garbage collector. Once you’ve completed this lesson you will be able to explain how each of the garbage collectors work and describe the meaning of the output produced in the GC logs for a given garbage collector along with being able to make informed decisions when it comes to tuning the JVM’s garbage collector.
Lesson 4
Lesson 4, “Tune the HotSpot JVM Step-by-Step,” presents a step-by-step approach to tuning the HotSpot JVM. This lesson walks you through the steps of creating a plan of attack by documenting the footprint, throughput and latency requirements that the Java application needs to have met. Then the lesson shifts to showing a flowchart that illustrates the step-by-step tuning process. The remainder of the lesson takes you through the step-by-step process by evaluating the expected memory footprint required to run your Java application. Then it turns to evaluating latency performance of your Java application and potentially tuning the JVM to meet the latency requirements. Similarly it covers throughput requirements and potentially tuning the JVM for throughput. This lesson concludes by showing some additional JVM command line options that may help improve your application’s performance that are not necessarily specific to tuning the JVM’s garbage collector.
The LiveLessons Video Training series publishes hundreds of hands-on, expert-led video tutorials covering a wide selection of technology topics designed to teach you the skills you need to succeed. This professional and personal technology video series features world-leading author instructors published by your trusted technology brands: Addison-Wesley, Cisco Press, IBM Press, Pearson IT Certification, Prentice Hall, Sams, and Que. Topics include: IT Certification, Programming, Web Development, Mobile Development, Home and Office Technologies, Business and Management, and more. View all LiveLessons on InformIT at http://www.informit.com/livelessons
More Information
