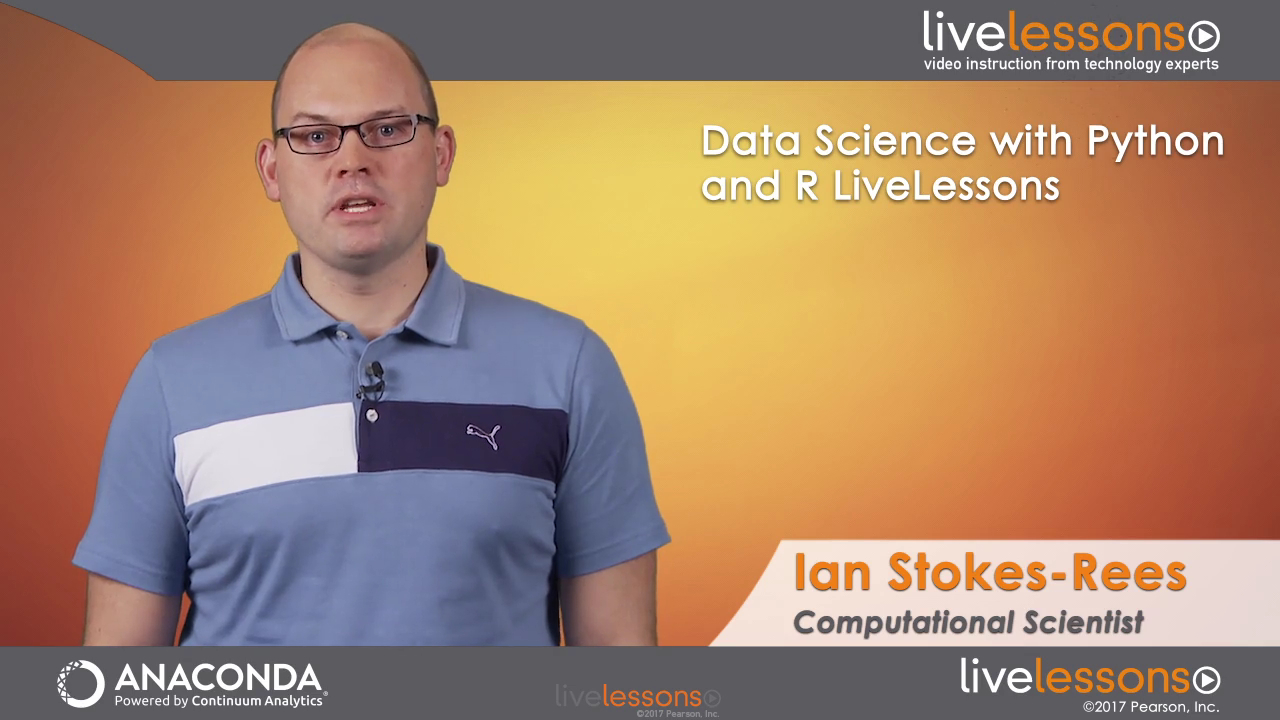
Data Science with Python and R LiveLessons (Anaconda Video Series)
- By Ian Stokes-Rees
- Published Feb 10, 2017 by Addison-Wesley Professional. Part of the LiveLessons series.
Online Video
- Sorry, this book is no longer in print.
- About this video
Video accessible from your Account page after purchase.
Register your product to gain access to bonus material or receive a coupon.
Description
- Copyright 2017
- Edition: 1st
- Online Video
- ISBN-10: 0-13-467262-3
- ISBN-13: 978-0-13-467262-5
9+ Hours of Video Training
Data Science with Python and R LiveLessons is tailored to beginner data scientists seeking to use Python or R for data science. This course includes fundamentals of data preparation, data analysis, data visualization, machine learning, and interactive data science applications. Students will learn how to build predictive models and how to create interactive visual applications for their line of business using the Anaconda platform. This course will introduce data scientists to using Python and R for building on an ecosystem of hundreds of high performance open source tools.
The companion Jupyter notebooks for these LiveLessons are available at https://anaconda.org/datasciencepythonr.
Skill Level
- Beginner level for data scientists
What You Will Learn
- Use Anaconda and Jupyter notebooks
- Understand Open Data Science concepts, roles, and workflows
- Wrangle data with Pandas
- Understand Anaconda Enterprise and collaboration workflows
- Create interactive visualizations with Bokeh
- Use Conda package management
- Use R for data processing and visualization
- Build statistical and predictive models
- Use Excel and Python with Anaconda Fusion
- Understand and use Mosaic for databases with distributed data
- Understand distributed and parallel computing with Dask
Course Requirements
- Basic experience in Python programming
- Anaconda installed. Python. Anaconda downloads are available for Apple OS X®, Microsoft Windows®, and most Linux distributions. Optionally, Anaconda Trial, which includes features in the paid subscriptions, is available for download.
About Anaconda Powered by Continuum Analytics
Anaconda is the leading Open Data Science platform powered by Python, the fastest growing data science language with more than 11 million downloads to date. Continuum Analytics is the creator and driving force behind Anaconda, empowering leading businesses across industries worldwide with tools to identify patterns in data, uncover key insights and transform basic data into a goldmine of intelligence to solve the world’s most challenging problems. Anaconda puts superpowers into the hands of people who are changing the world. Learn more at continuum.io.The LiveLessons Video Training series publishes hundreds of hands-on, expert-led video tutorials covering a wide selection of technology topics designed to teach you the skills you need to succeed. This professional and personal technology video series features world-leading author instructors published by your trusted technology brands: Addison-Wesley, Cisco Press, IBM Press, Pearson IT Certification, Prentice Hall, Sams, and Que. Topics include: IT Certification, Programming, Web Development, Mobile Development, Home and Office Technologies, Business and Management, and more. View all LiveLessons on InformIT at http://www.informit.com/livelessons.
Sample Content
Table of Contents
Part I: Introduction to Anaconda
Lesson 1: Open Data Science for Everyone
Learning objectives
1.1 Use Anaconda Repository for data science artifacts
1.2 Use Anaconda Navigator to open and run Jupyter Notebooks
1.3 Perform fundamental Jupyter operations
1.4 Ingest, analyze and clean data with Pandas
1.5 Visualize data with Bokeh
1.6 Create machine learning and predictive modeling with Scikit-Learn
Lesson 2: Background Concepts for Open Data Science
Learning objectives
2.1 Understand the concept of Open Data Science
2.2 Identify the different personas on an Open Data Science team
2.3 Understand Open Data Science workflows
Lesson 3: Data Wrangling with Pandas
Learning objectives
3.1 Load, view and plot Pandas DataFrames
3.2 Modify content and create new columns
3.3 Use boolean masks for data selection
3.4 Read data from disk
3.5 Group data
3.6 Connect to a database
3.7 Work with time series data
3.8 Read and write Excel files
3.9 Publish notebooks to Anaconda Cloud
Lesson 4: Anaconda Platform Overview
Learning objectives
4.1 Describe the Anaconda Distribution
4.2 Identify what Conda is used for
4.3 Relate Anaconda Enterprise components
4.4 Identify core technology components
4.5 Describe typical data science workflows
4.6 Create projects in Anaconda enterprise with a team
Lesson 5: Creating Interactive Visualizations with Bokeh
Learning objectives
5.1 Describe Bokeh
5.2 Plot Pandas DataFrames with bokeh.chart
5.3 Manage plot construction with bokeh.plotting
5.4 Use widgets and plot linking for interactivity
5.5 Create web plots
5.6 Create data apps using Bokeh Server
Lesson 6: Conda Package Management
Learning objectives
6.1 Install packages from Navigator
6.2 Add channels from Navigator
6.3 Upgrade, downgrade and remove packages from Navigator
6.4 Create a new environment from Navigator
6.5 Select Conda environments and Jupyter kernels
6.6 Use Conda from the command line
6.7 Understand the difference between pip and conda
6.8 Keep pip and conda up to date
6.9 Export, save, and share Conda environments
6.10 Find packages on Anaconda Cloud and from Conda-Forge
Part II: Exploring and Analyzing
Lesson 7: Data Processing and Visualization in R
Learning objectives
7.1 Configure an R analytics environment
7.2 Access and process data with dplyr and tidyr
7.3 Create visualizations with ggplot
7.4 Use linear models for predictive analytics
7.5 Create interactive visualizations with rBokeh and Shiny
7.6 Bridge between R and Python with rpy2
Lesson 8: Build Statistical and Predictive Models
Learning objectives
8.1 Use Scikit-Learn to create a predictive model
8.2 Generate predictions with a model
8.3 Score a model
8.4 Visualize model performance
Lesson 9: Excel and Python with Anaconda Fusion
Learning objectives
9.1 Understand which problems Fusion solves
9.2 Install and start Fusion
9.3 Connect spreadsheets to codesheets
Lesson 10: Databases and Distributed Data with Mosaic
Learning objectives
10.1 Understand which problems Mosaic solves
10.2 Install and start Mosaic
10.3 Use Mosaic to register datasets and create data views
Lesson 11: Distributed and Parallel Computing with Dask
Learning objectives
11.1 Describe Dask in relation to Pandas
11.2 Profile the creation of Dask dataframes
11.3 Analyze and plot Dask data
Summary
More Information

