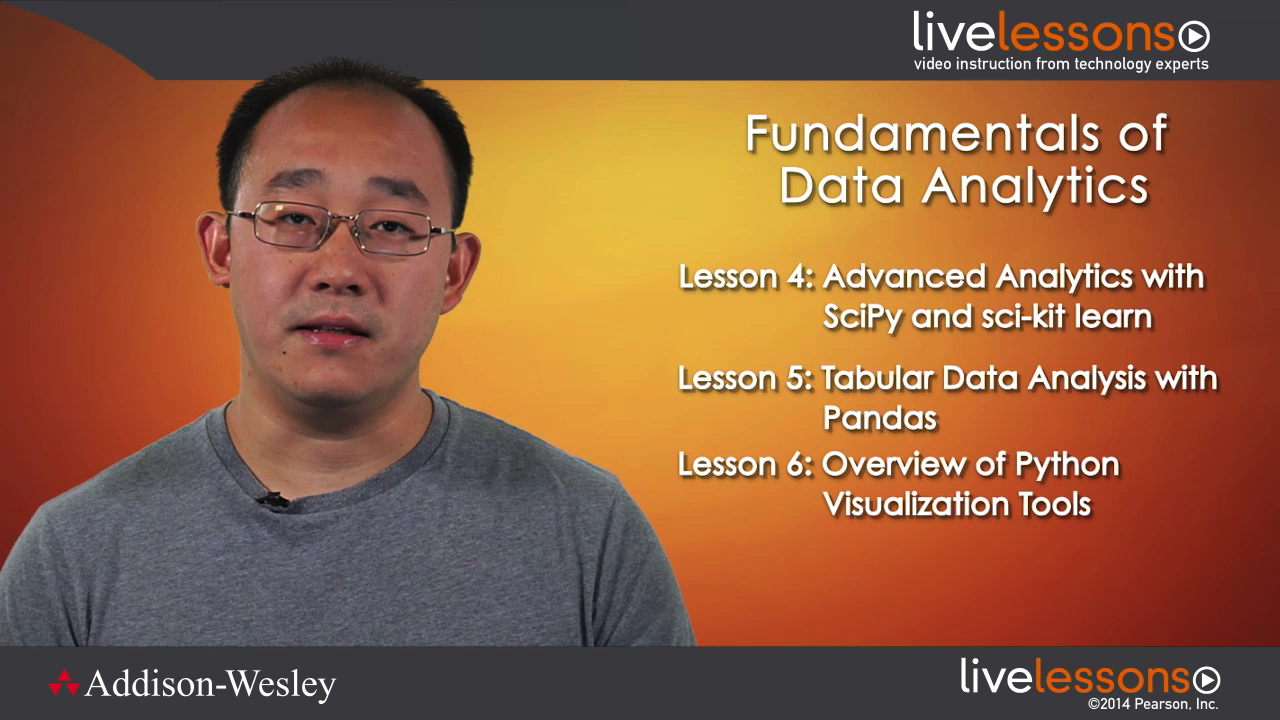
Fundamentals of Data Analytics in Python LiveLessons (Video Training)
- By Peter Wang, Aron Ahmadia
- Published Oct 18, 2013 by Addison-Wesley Professional. Part of the LiveLessons series.
Downloadable Video
- Sorry, this book is no longer in print.
- About this video
Accessible from your Account page after purchase. Requires the free QuickTime Player software.
Videos can be viewed on: Windows 8, Windows XP, Vista, 7, and all versions of Macintosh OS X including the iPad, and other platforms that support the industry standard h.264 video codec.
Register your product to gain access to bonus material or receive a coupon.
Description
- Copyright 2014
- Edition: 1st
- Downloadable Video
- ISBN-10: 0-13-359945-0
- ISBN-13: 978-0-13-359945-9
3+ Hours of Video Instruction
Python has become the language of choice for most fields in the scientific community, and this is expanding to businesses investing in analytics resources. Fundamentals of Data Analytics in Python LiveLessons is a coherent, narrative tutorial that strikes the right balance between teaching the "how" and the "why" of data analytics in Python. This video begins with an abbreviated primer on Python, and then proceeds to cover open source Python tools relevant to solving day-to-day scientific and engineering programming problems.
Peter Wang is co-founder and president of Continuum Analytics. Peter holds a B.A. in Physics from Cornell University and has been developing applications professionally using Python since 2001. Before co-founding Continuum Analytics in 2011, Peter spent seven years at Enthought designing and developing applications for a variety of companies, including investment bankers, high-frequency trading firms, oil companies, and others. In 2007, Peter was named Director of Technical Architecture and served as client liaison on high-profile projects. Peter also developed Chaco, an open-source, Python-based toolkit for interactive data visualization. Peter's roles at Continuum Analytics include product design and development, software management, business strategy, and training.
Aron Ahmadia is a research scientist at Continuum Analytics. Aron holds a Ph.D. in Applied Mathematics from Columbia University and has been working with Python for technical computing since 2003. Aron is one of the lead developers of PyClaw, an open-source, Python-based toolkit for modeling wave propagation at large scale. His software is used in academia, industry, and government, and runs on workstations, the cloud, and 65,536-core supercomputers. Aron has extensive experience teaching Python to industrial, academic, and government users, and has taught it as part of the curriculum for Software Carpentry courses across four continents.
Table of Contents
Lesson 1:
Getting Set Up with the Analytical Python Ecosystem introduces the various ways to download and get set up with the Python scientific and data analysis libraries using Anaconda or Canopy. We introduce IPython and the IPython Notebooks, and look at they ways they help us explore, visualize, and record our data analyses.
Lesson 2:
Basic Data Analysis with Python covers fundamental Python data structures and libraries for analysis, using a motivational web traffic example. Before we begin using advanced tools and libraries, we give you a hands-on tour of the power of the Python language and the batteries-included Python standard library for acquiring data and performing simple analyses.
Lesson 3:
Numerical Analysis with NumPy covers both the basics of how to use NumPy and what its basic operations and data structures are, motivated by a hands-on analysis of meteorological data acquired from the web. We also spend some time looking at the detailed information that NumPy uses "under the hood" to achieve its speeds and efficiency.
Lesson 4:
Advanced Analytics with SciPy and Scikit Learn introduces two major tools for Python analytics: SciPy, and Scikit-learn. Both of these are "omnibus" packages that include lots of smaller packages, and for both of them, we'll get a sense for the variety of features offered in the sub-packages. We continue motivating with a hands-on meteorological analysis.
Lesson 5:
Tabular Data Analysis with Pandas is a first look at how to use the Pandas library for some rudimentary analysis, and then build up to more advanced concepts such as Group-by operations on dataframes. We are more "hands-on" with a few of the examples than others, and throughout the process, you should get some sense for whether Pandas DataFrames and Series are a fit for the kinds of analytics you perform.
Lesson 6:
Overview of Python Visualization Tools takes a survey overview of the many kinds of visualization tools in the Python analytics space. While we won't go into too much detail into any single tool, the goal here is to give you a broader sense of what is available, and to motivate you to explore some of these more closely on your own.
LiveLessons Video Training series publishes hundreds of hands-on, expert-led video tutorials covering a wide selection of technology topics designed to teach you the skills you need to succeed. This professional and personal technology video series features world-leading author instructors published by your trusted technology brands: Addison-Wesley, Cisco Press, IBM Press, Pearson IT Certification, Prentice Hall, Sams, and Que. Topics include: IT Certification, Programming, Web Development, Mobile Development, Home & Office Technologies, Business & Management, and more. View All LiveLessons http://www.informit.com/imprint/series_detail.aspx?ser=2185116
Extras
Author's Site
Visit wakari.io/training for additional content and commentary on this LiveLesson.
More Information

